Upcoming Events
05 February 2025, 3:45-5:15 PM Eastern Time — The survey Package for R: What, How, and Why?
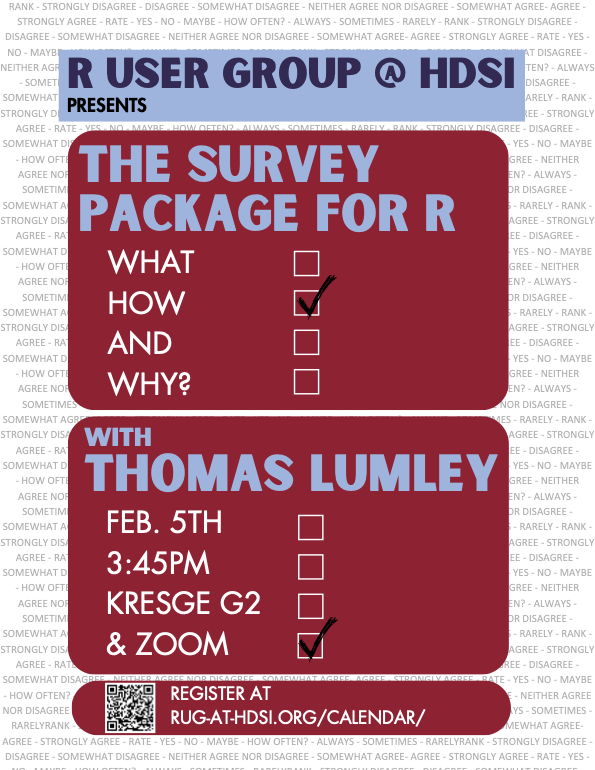
The survey package for R was developed to allow routine statistical analysis to account for complex sampling designs, and to provide a platform for new research. I will explain how the package represents survey designs and the importance of influence functions in thinking about and implementing survey analyses generically. I will also talk about some of the analyses the package supports and some it does not support. There will be extended time for discussion: bring your questions.
Past Events
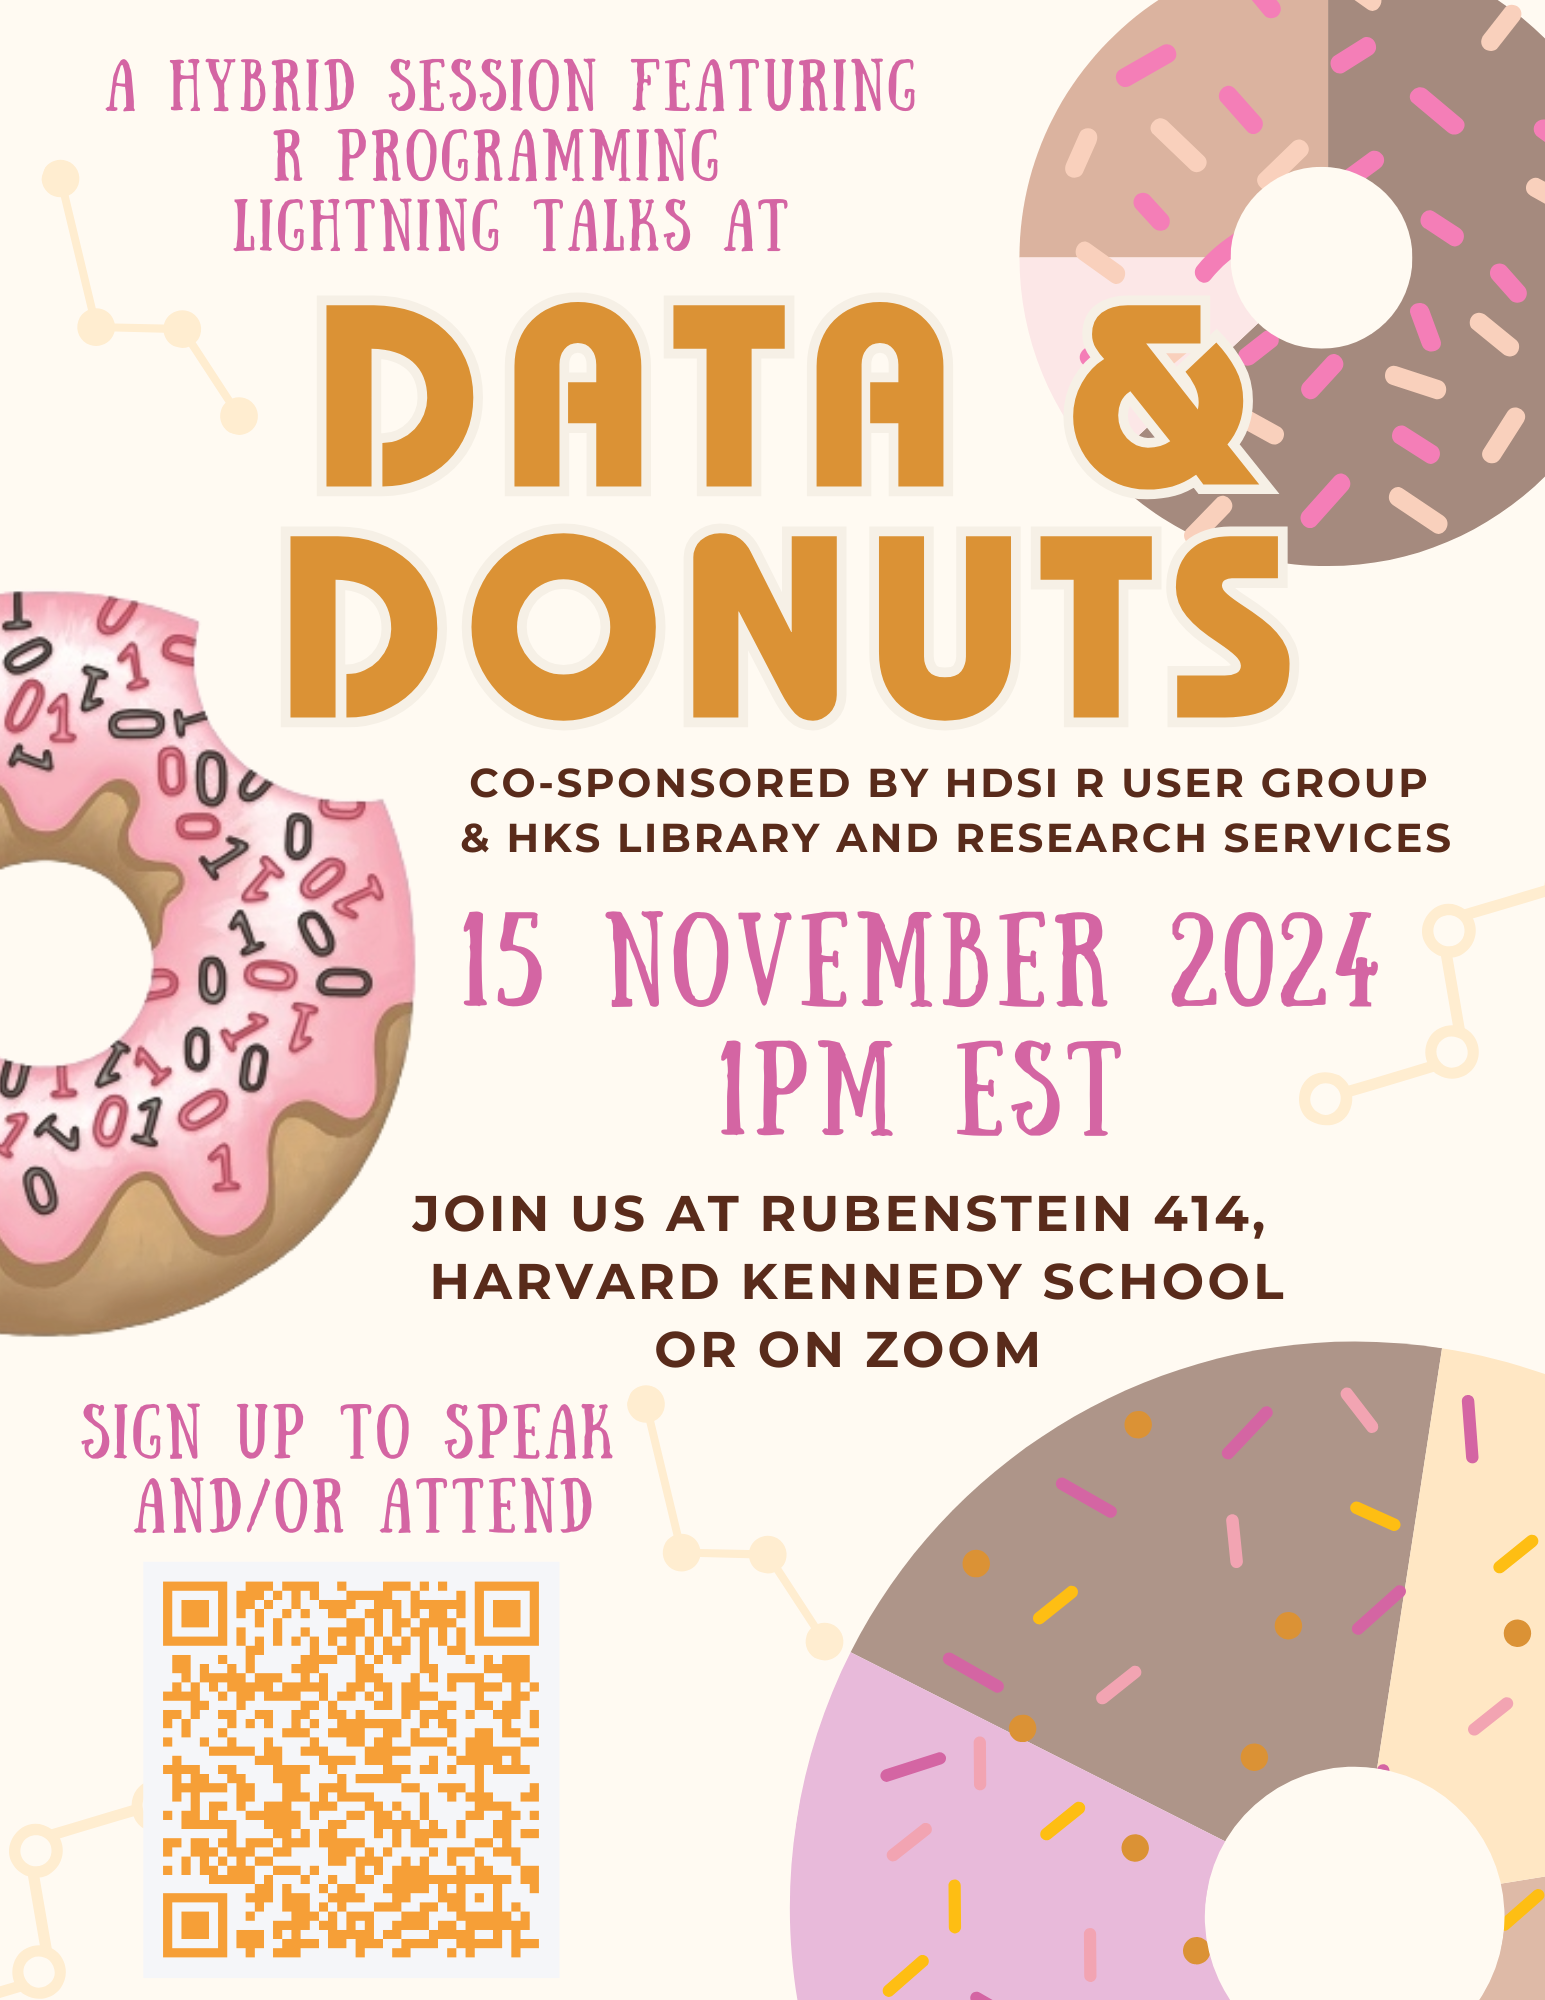
15 November 2024 — Lightning Talks! with HKS Data + Donuts
06 June 2024 — The Magic of Regular Expressions
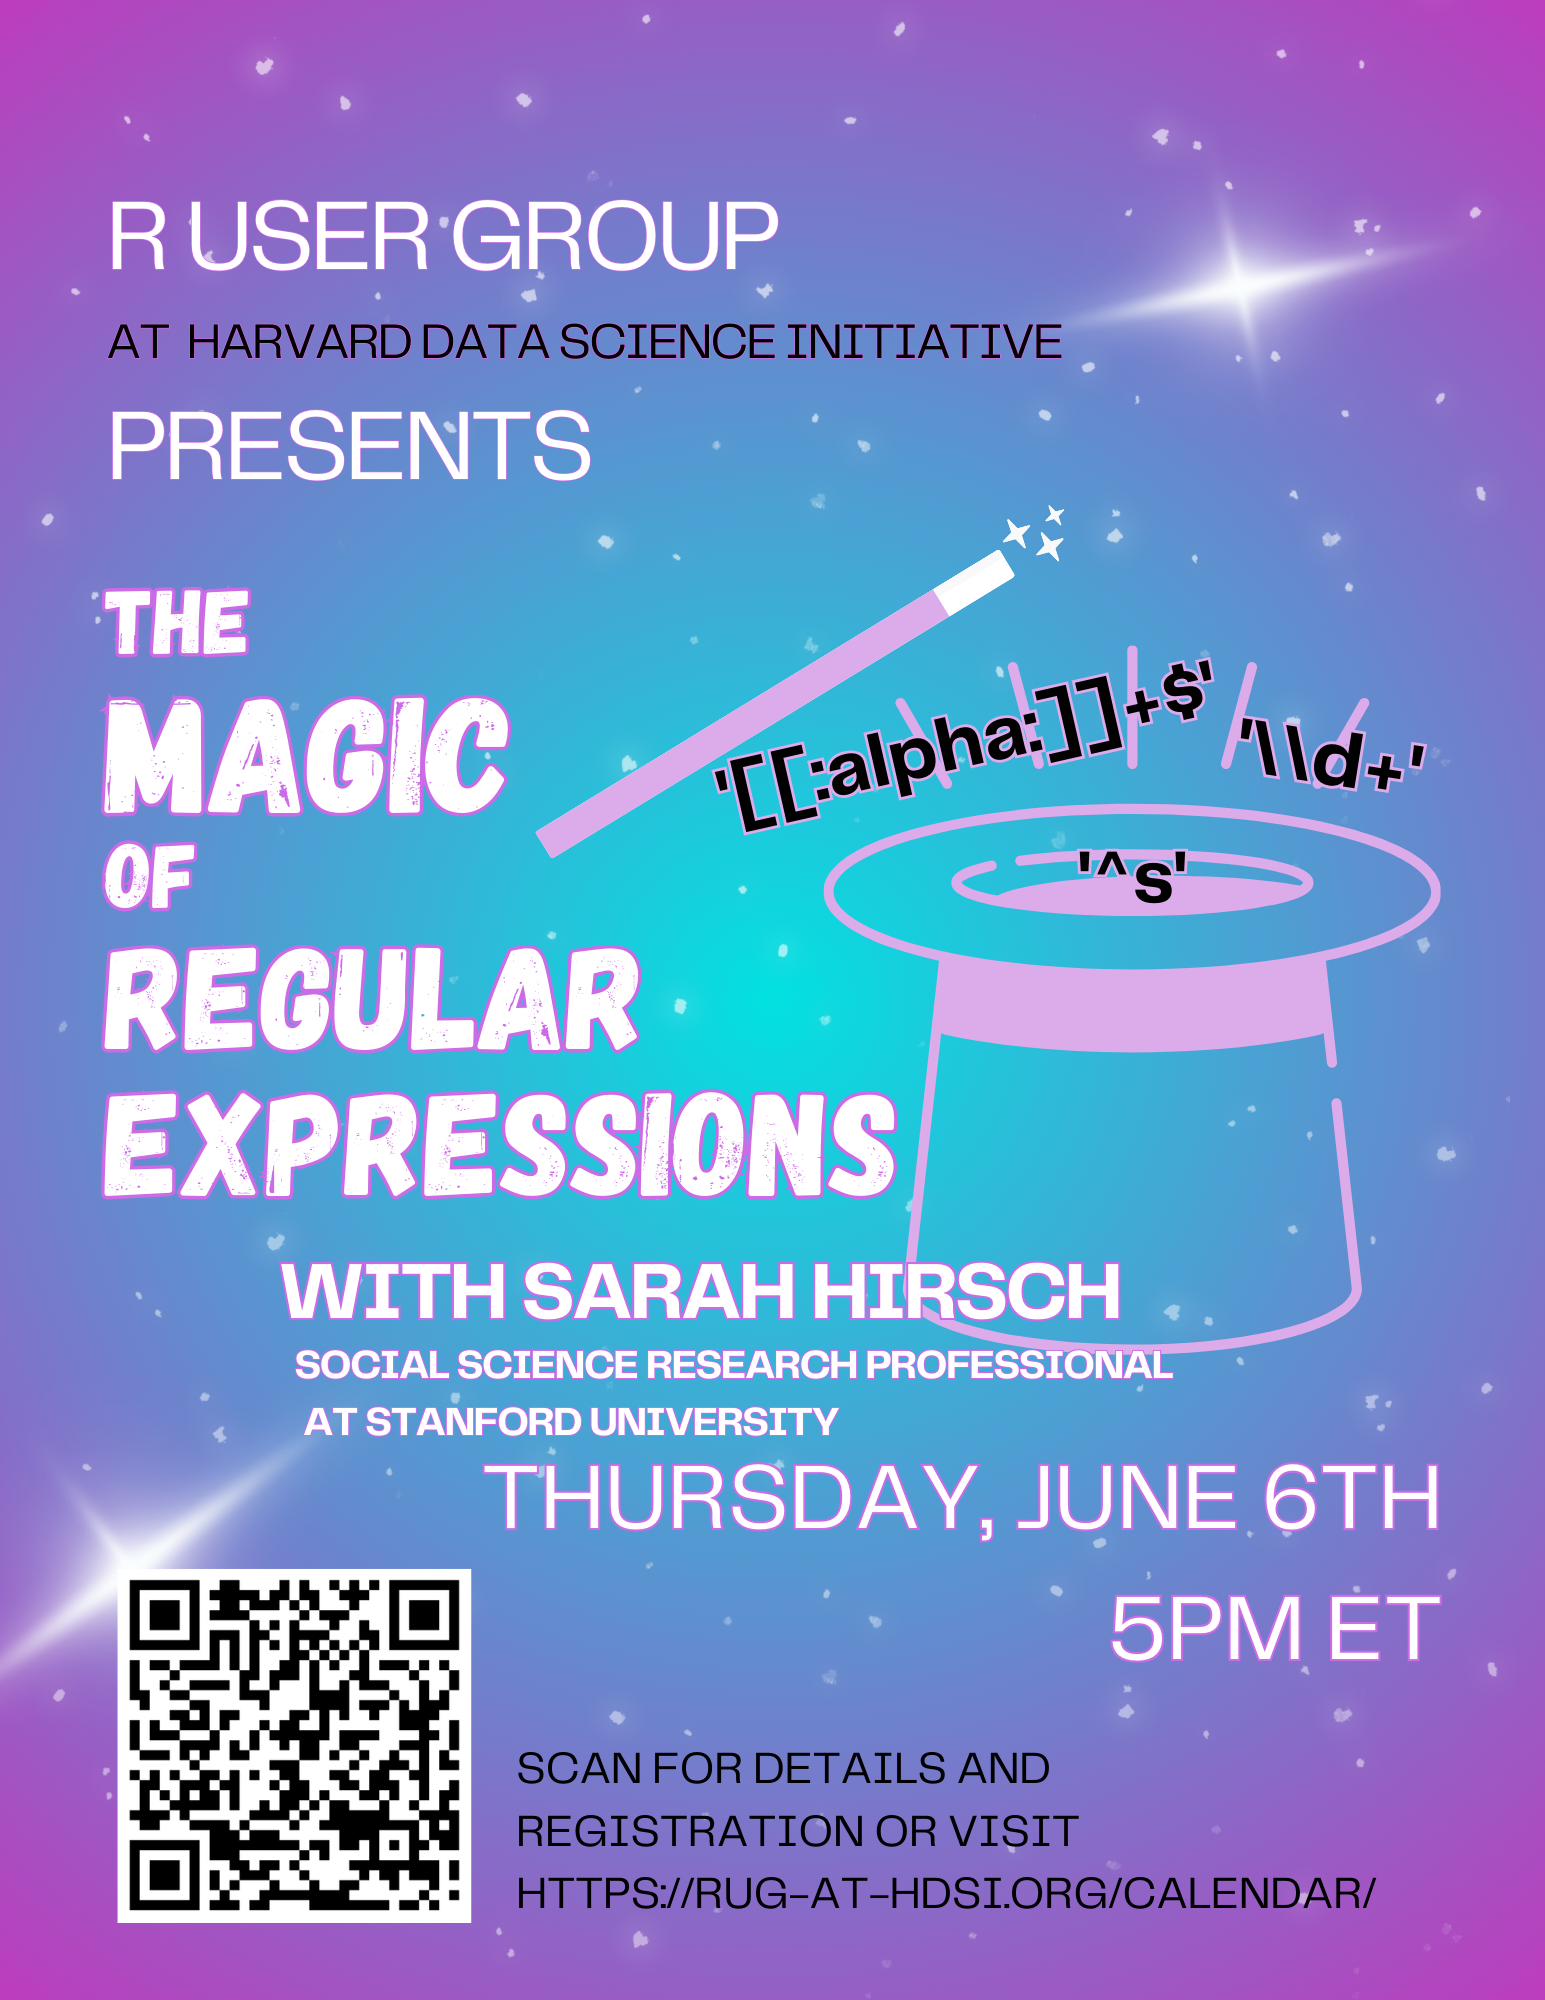
Have you ever wondered about coding shorthand that uses special symbols like ^, $, +, and *? Does it seem too strange and impenetrable to understand, much less use? Start chipping away at that iceberg and join us to learn more about regular expressions, an efficient and powerful way to parse and clean text data.
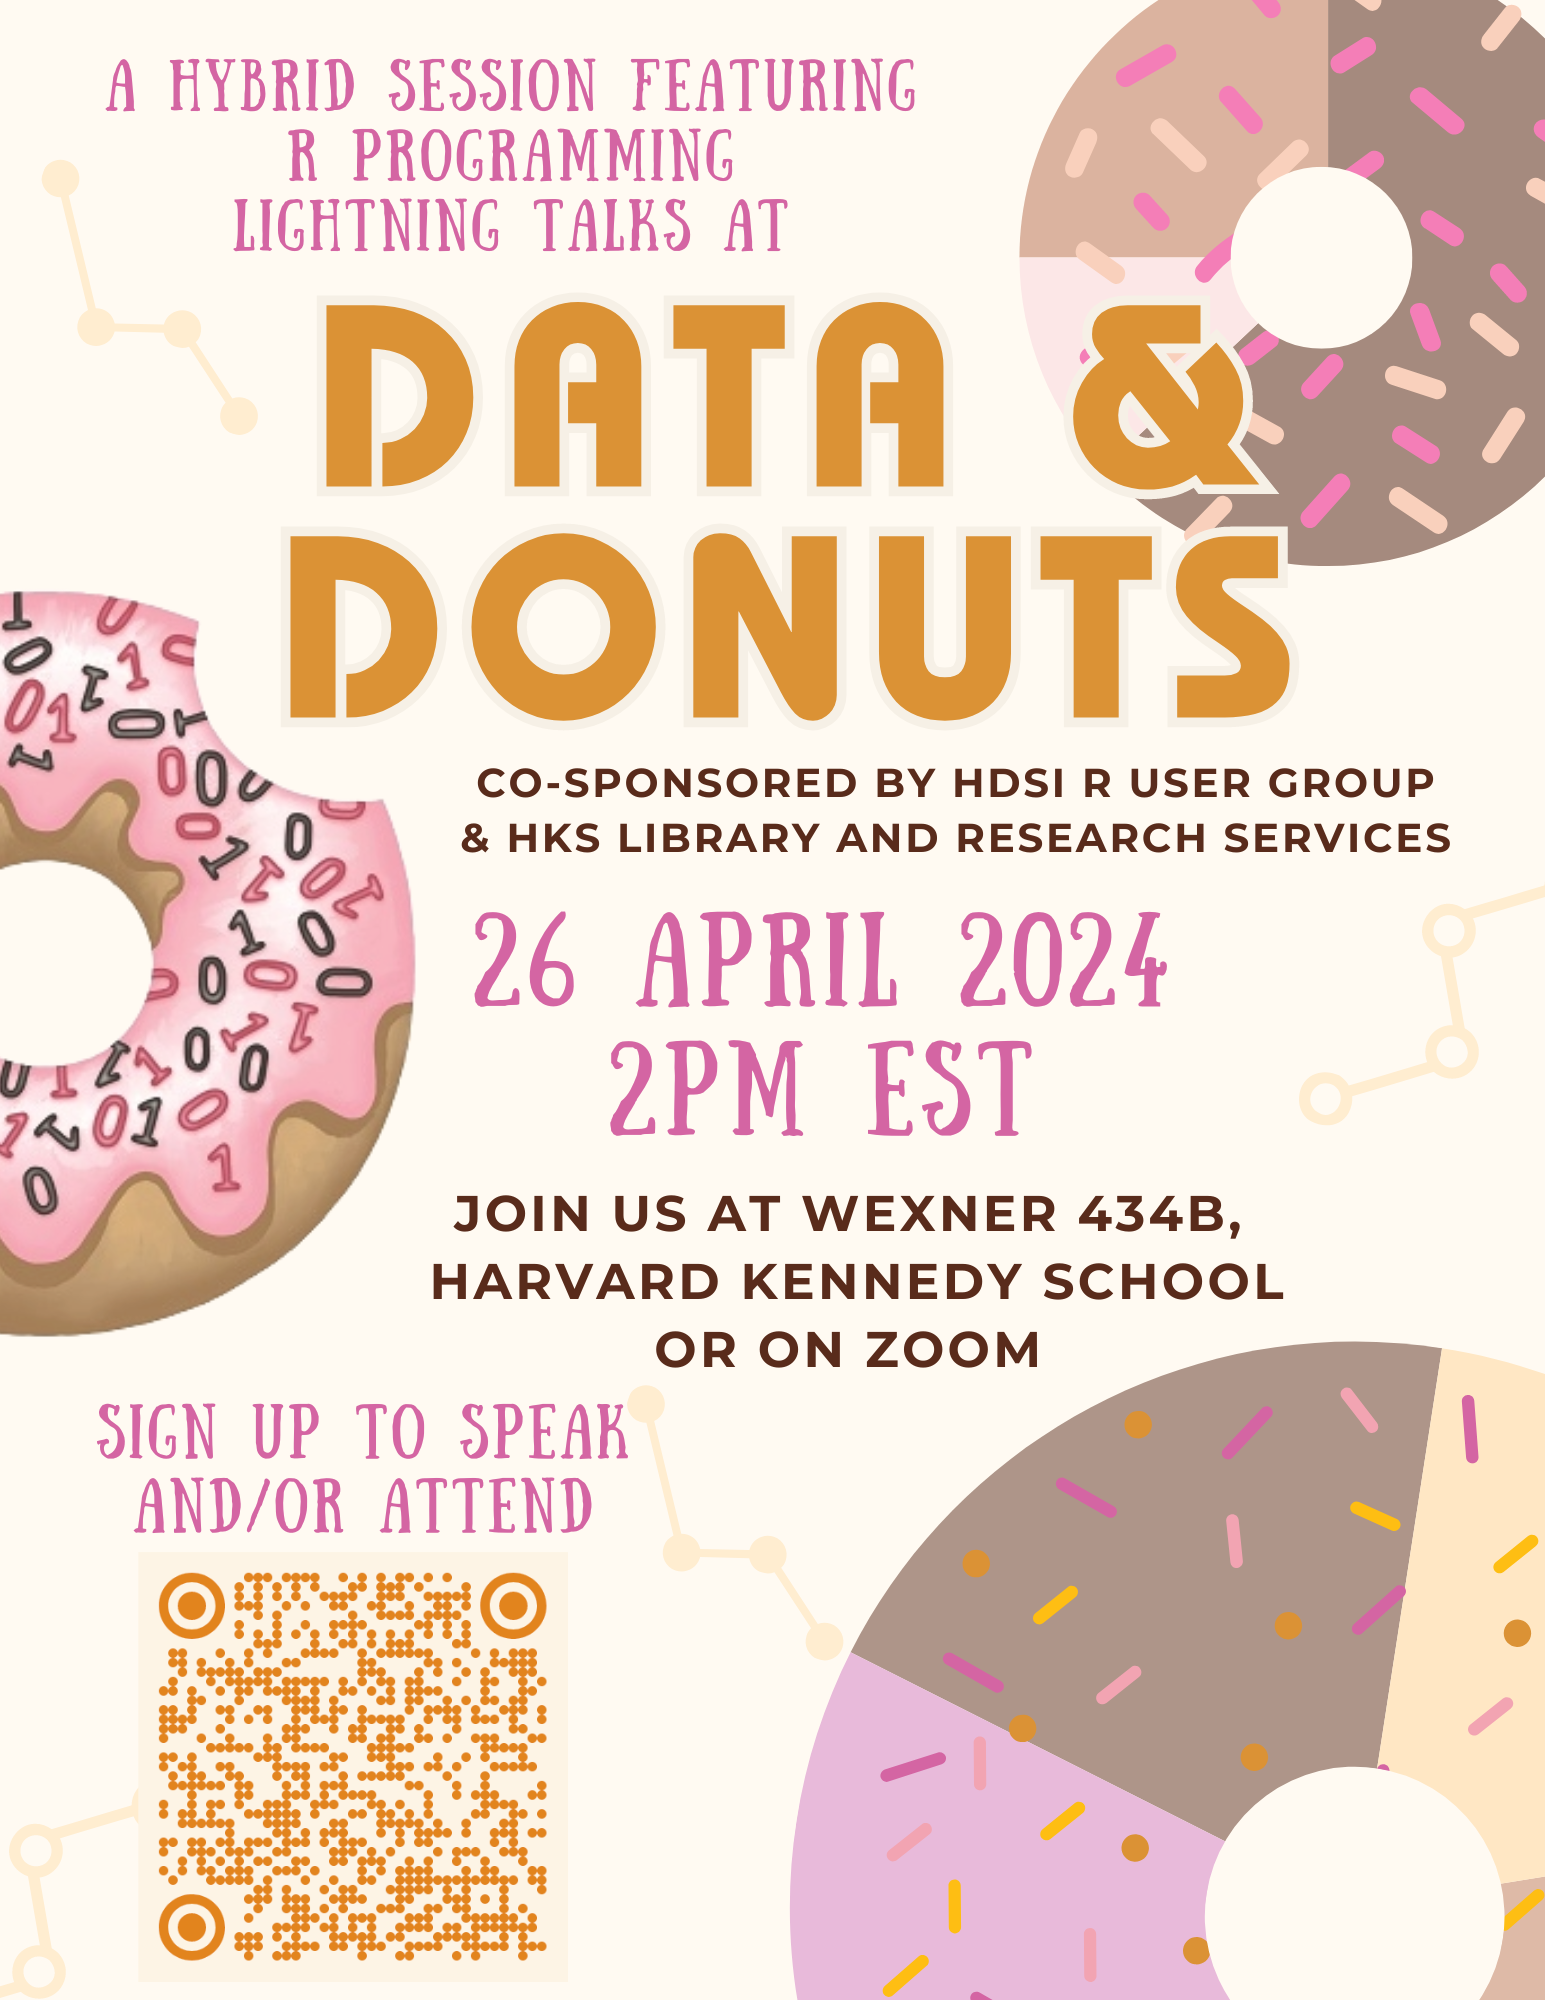
26 April 2024 — Lightning Talks with HKS Data+Donuts!
16 November 2023 — Tools and Teams for Reproducible Science
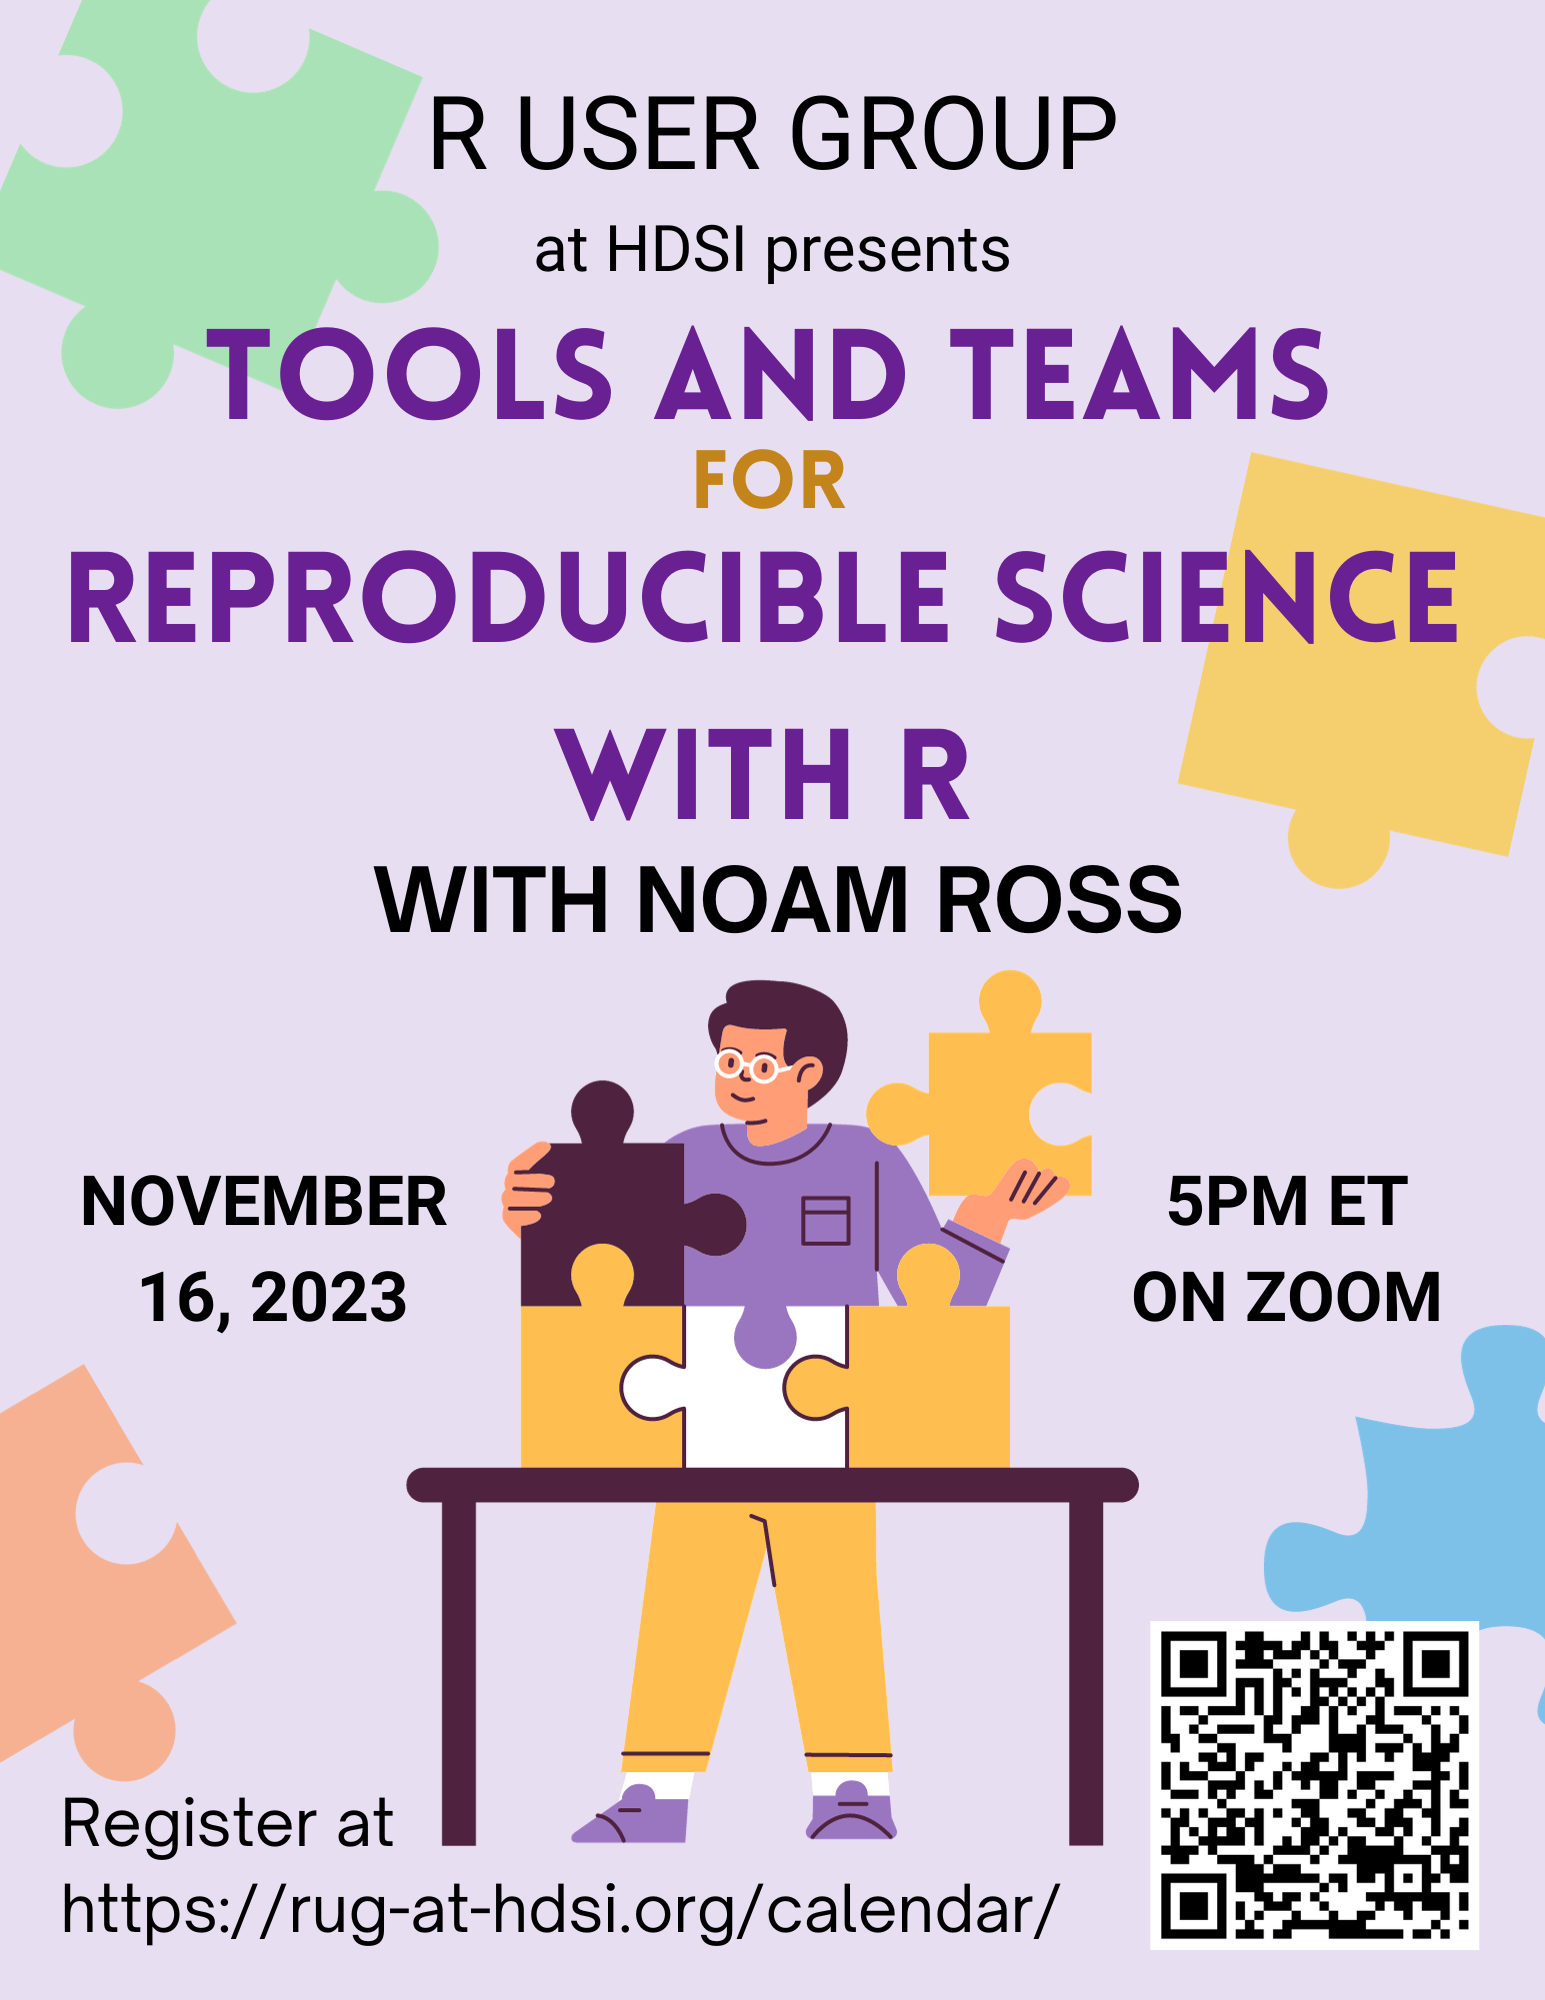
R is great for scientific reproducibility, but as work scales from individual to teams, organizations, and collaborations across teams, time, and space, R scripts and git repositories are no longer sufficient to capture project complexity. Reproducibility has to work for field, lab, analytical, and policy groups, and address challenges such as high-performance computing, large data, data privacy and security, and the re-use of data and analyses across separate but related projects. I will present lessons learned at EcoHealth Alliance in making reproducible R-based projects work for collaborative and interdisciplinary science. I will showcase tools and approaches we have adopted and developed beyond standard best practices. I will discuss the team structure, onboarding and ongoing training we conduct to make R and reproducibility a core pillar of our research.
26 October 2023 — What's New in Tidymodels
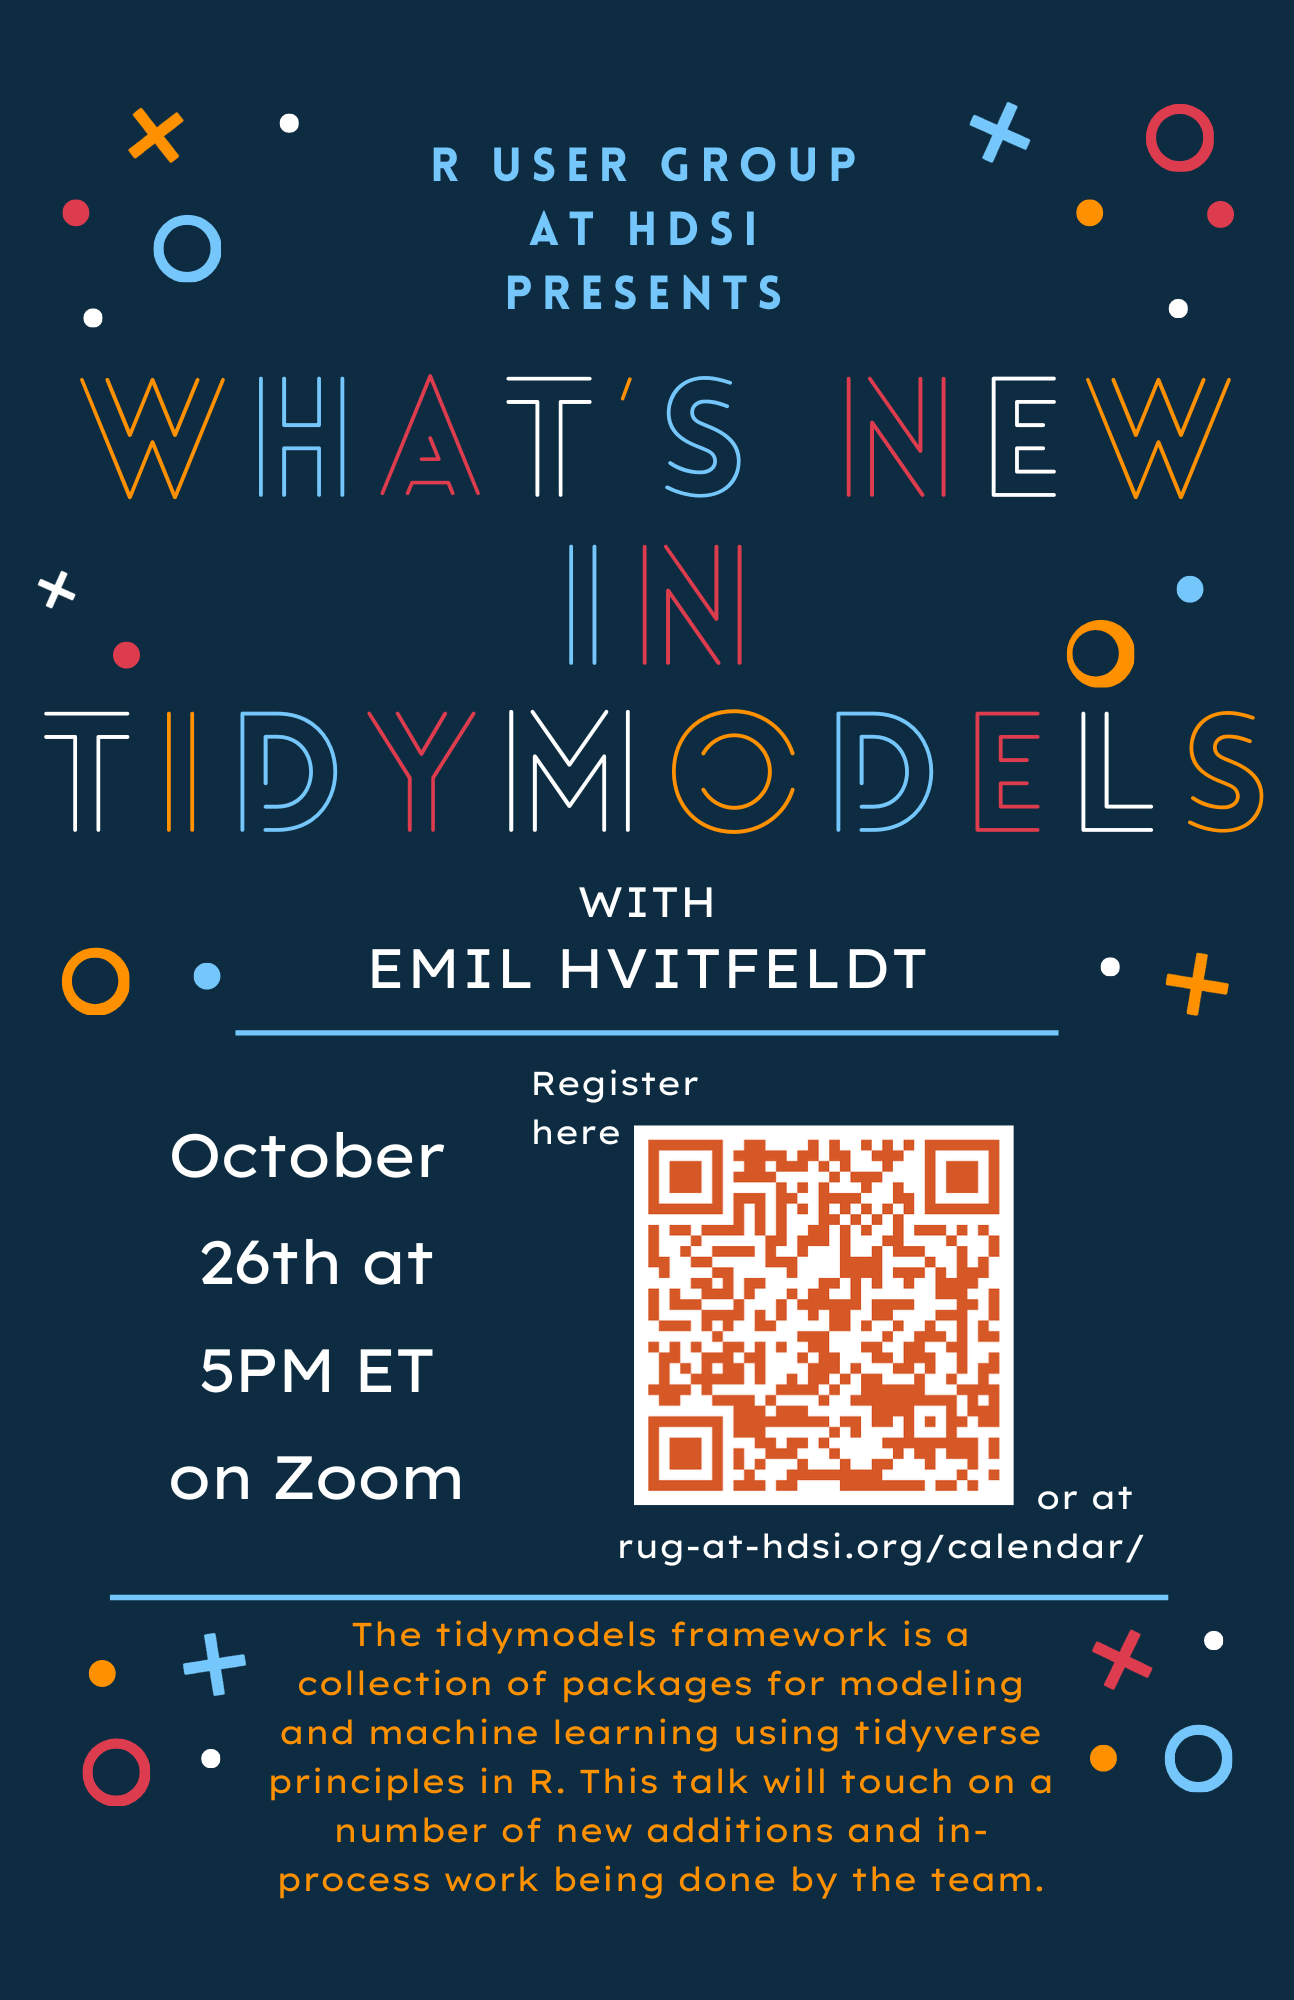
The tidymodels framework is a collection of packages for modeling and machine learning using tidyverse principles. This talk will touch on a number of new additions and in-process work being done by the team.
13 July 2023 — Intro to Functional Programming in R
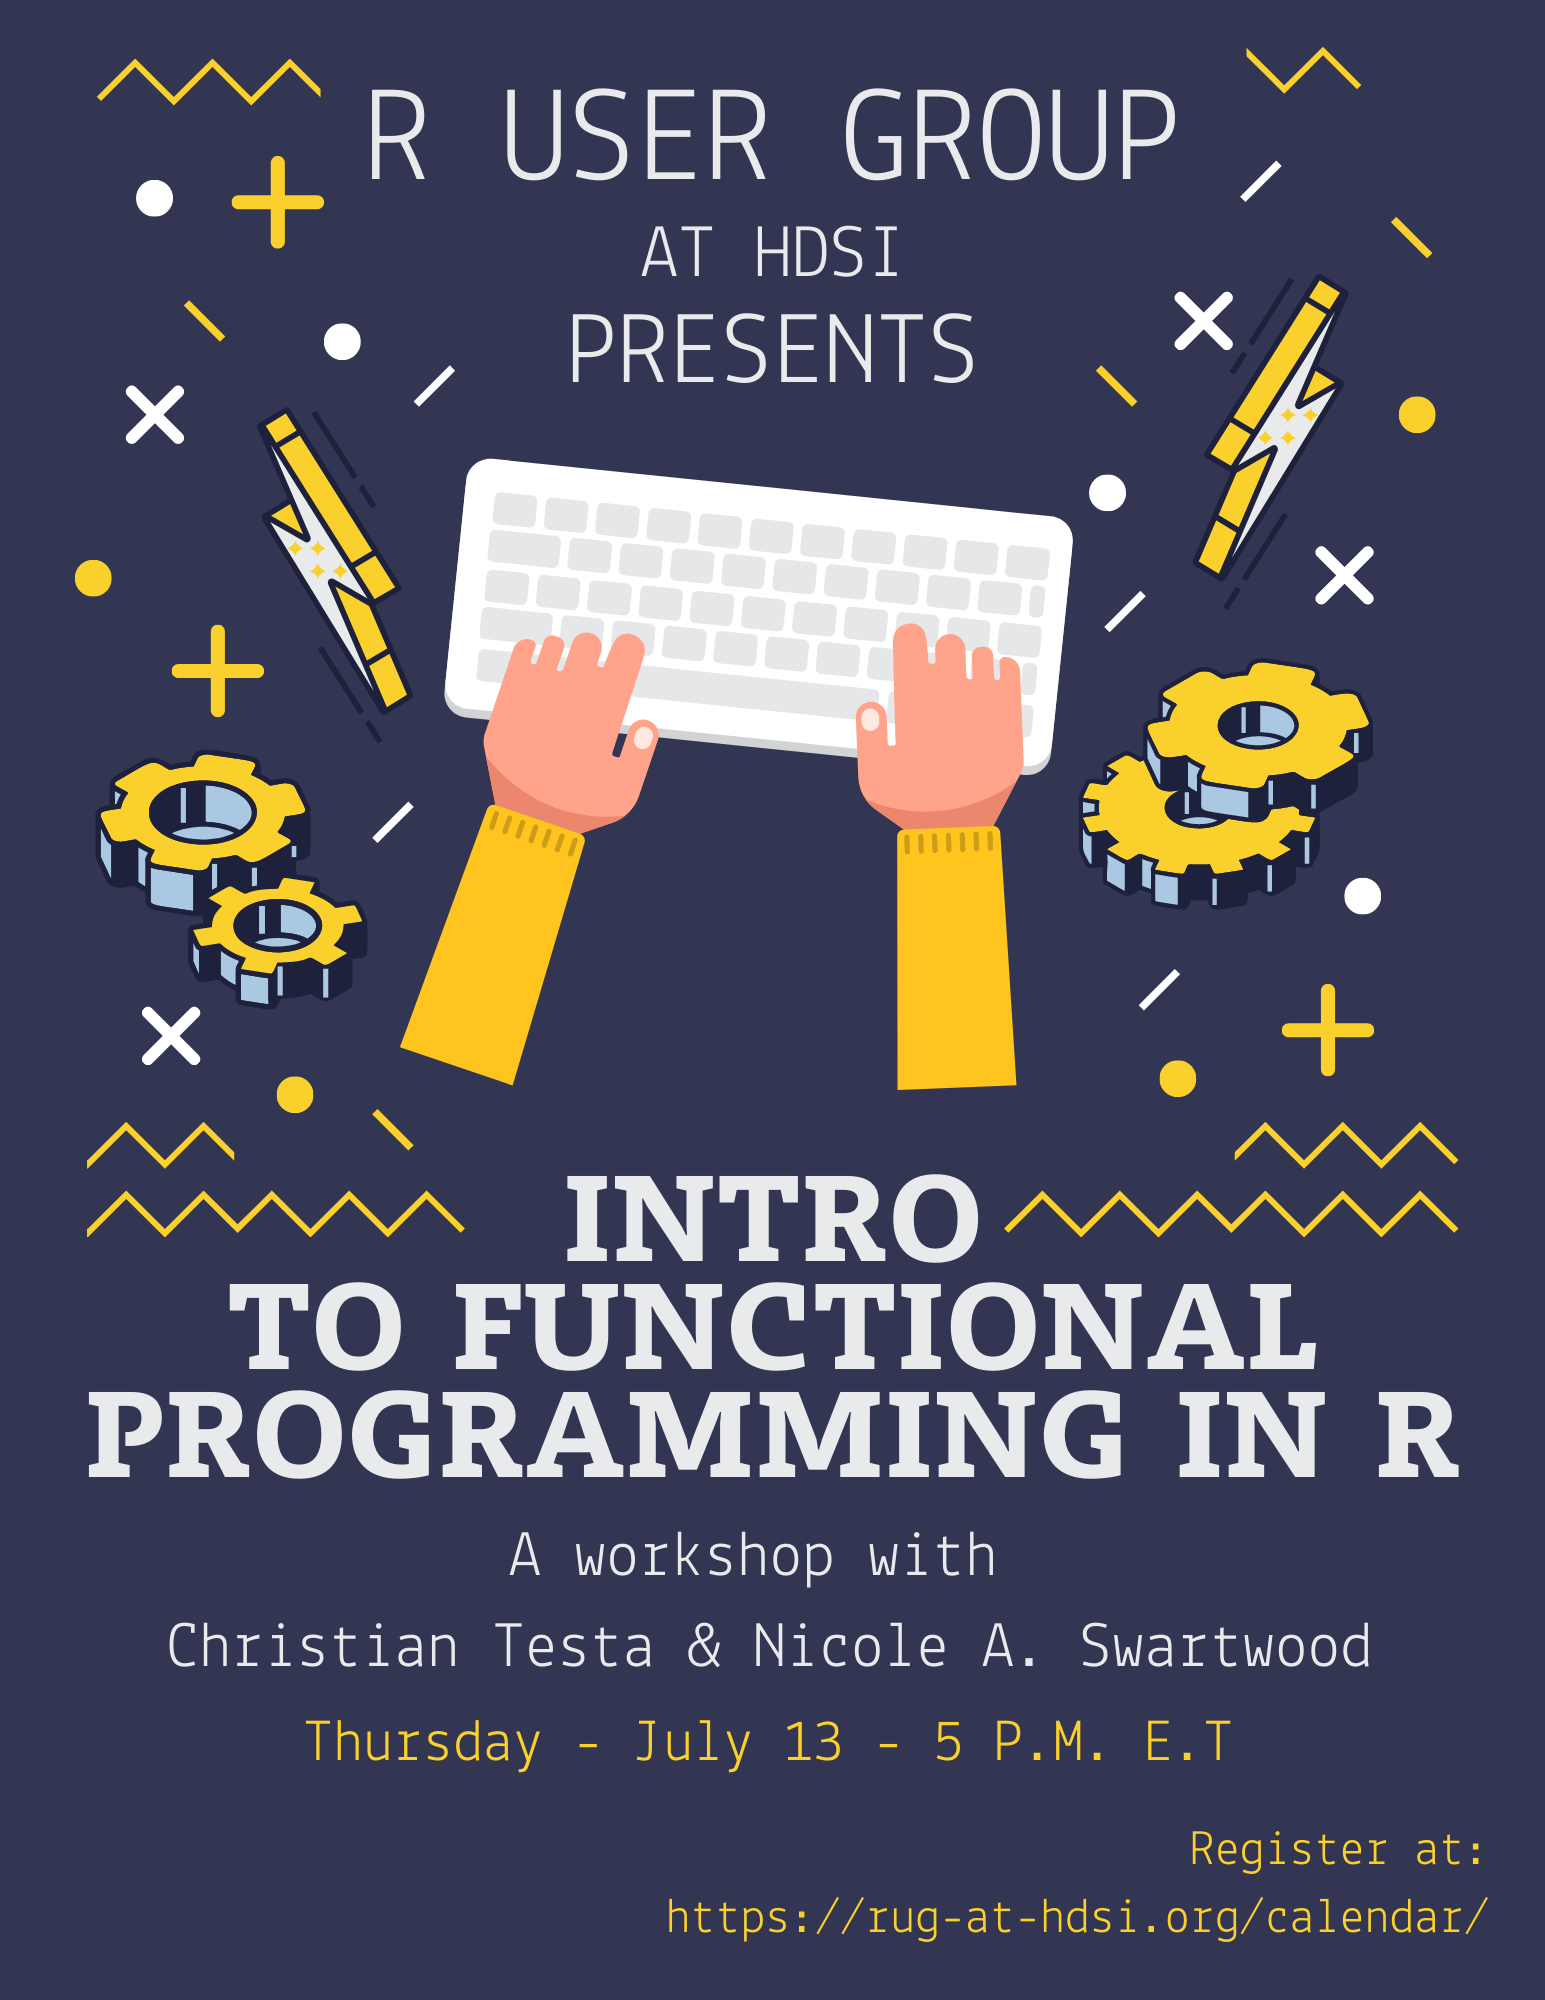
Christian and Nicole will provide an introduction to functional programming in R. In case you haven't heard of functional programming before, it's a powerful programming technique that allows programmers to pass functions as arguments and write code that applies functions repeatedly on the programmer's behalf. This means we can do some quite nifty things like succinctly applying one function to a whole list of objects, creating lists of functions, or passing functions as variables to other functions. Functional programming is a great skill for any R programmer to have in their back-pocket and can take your programming to the next level, increasing your productivity and making it easier for you to solve complex problems.
18 May 2023 — HTML and CSS for R Users
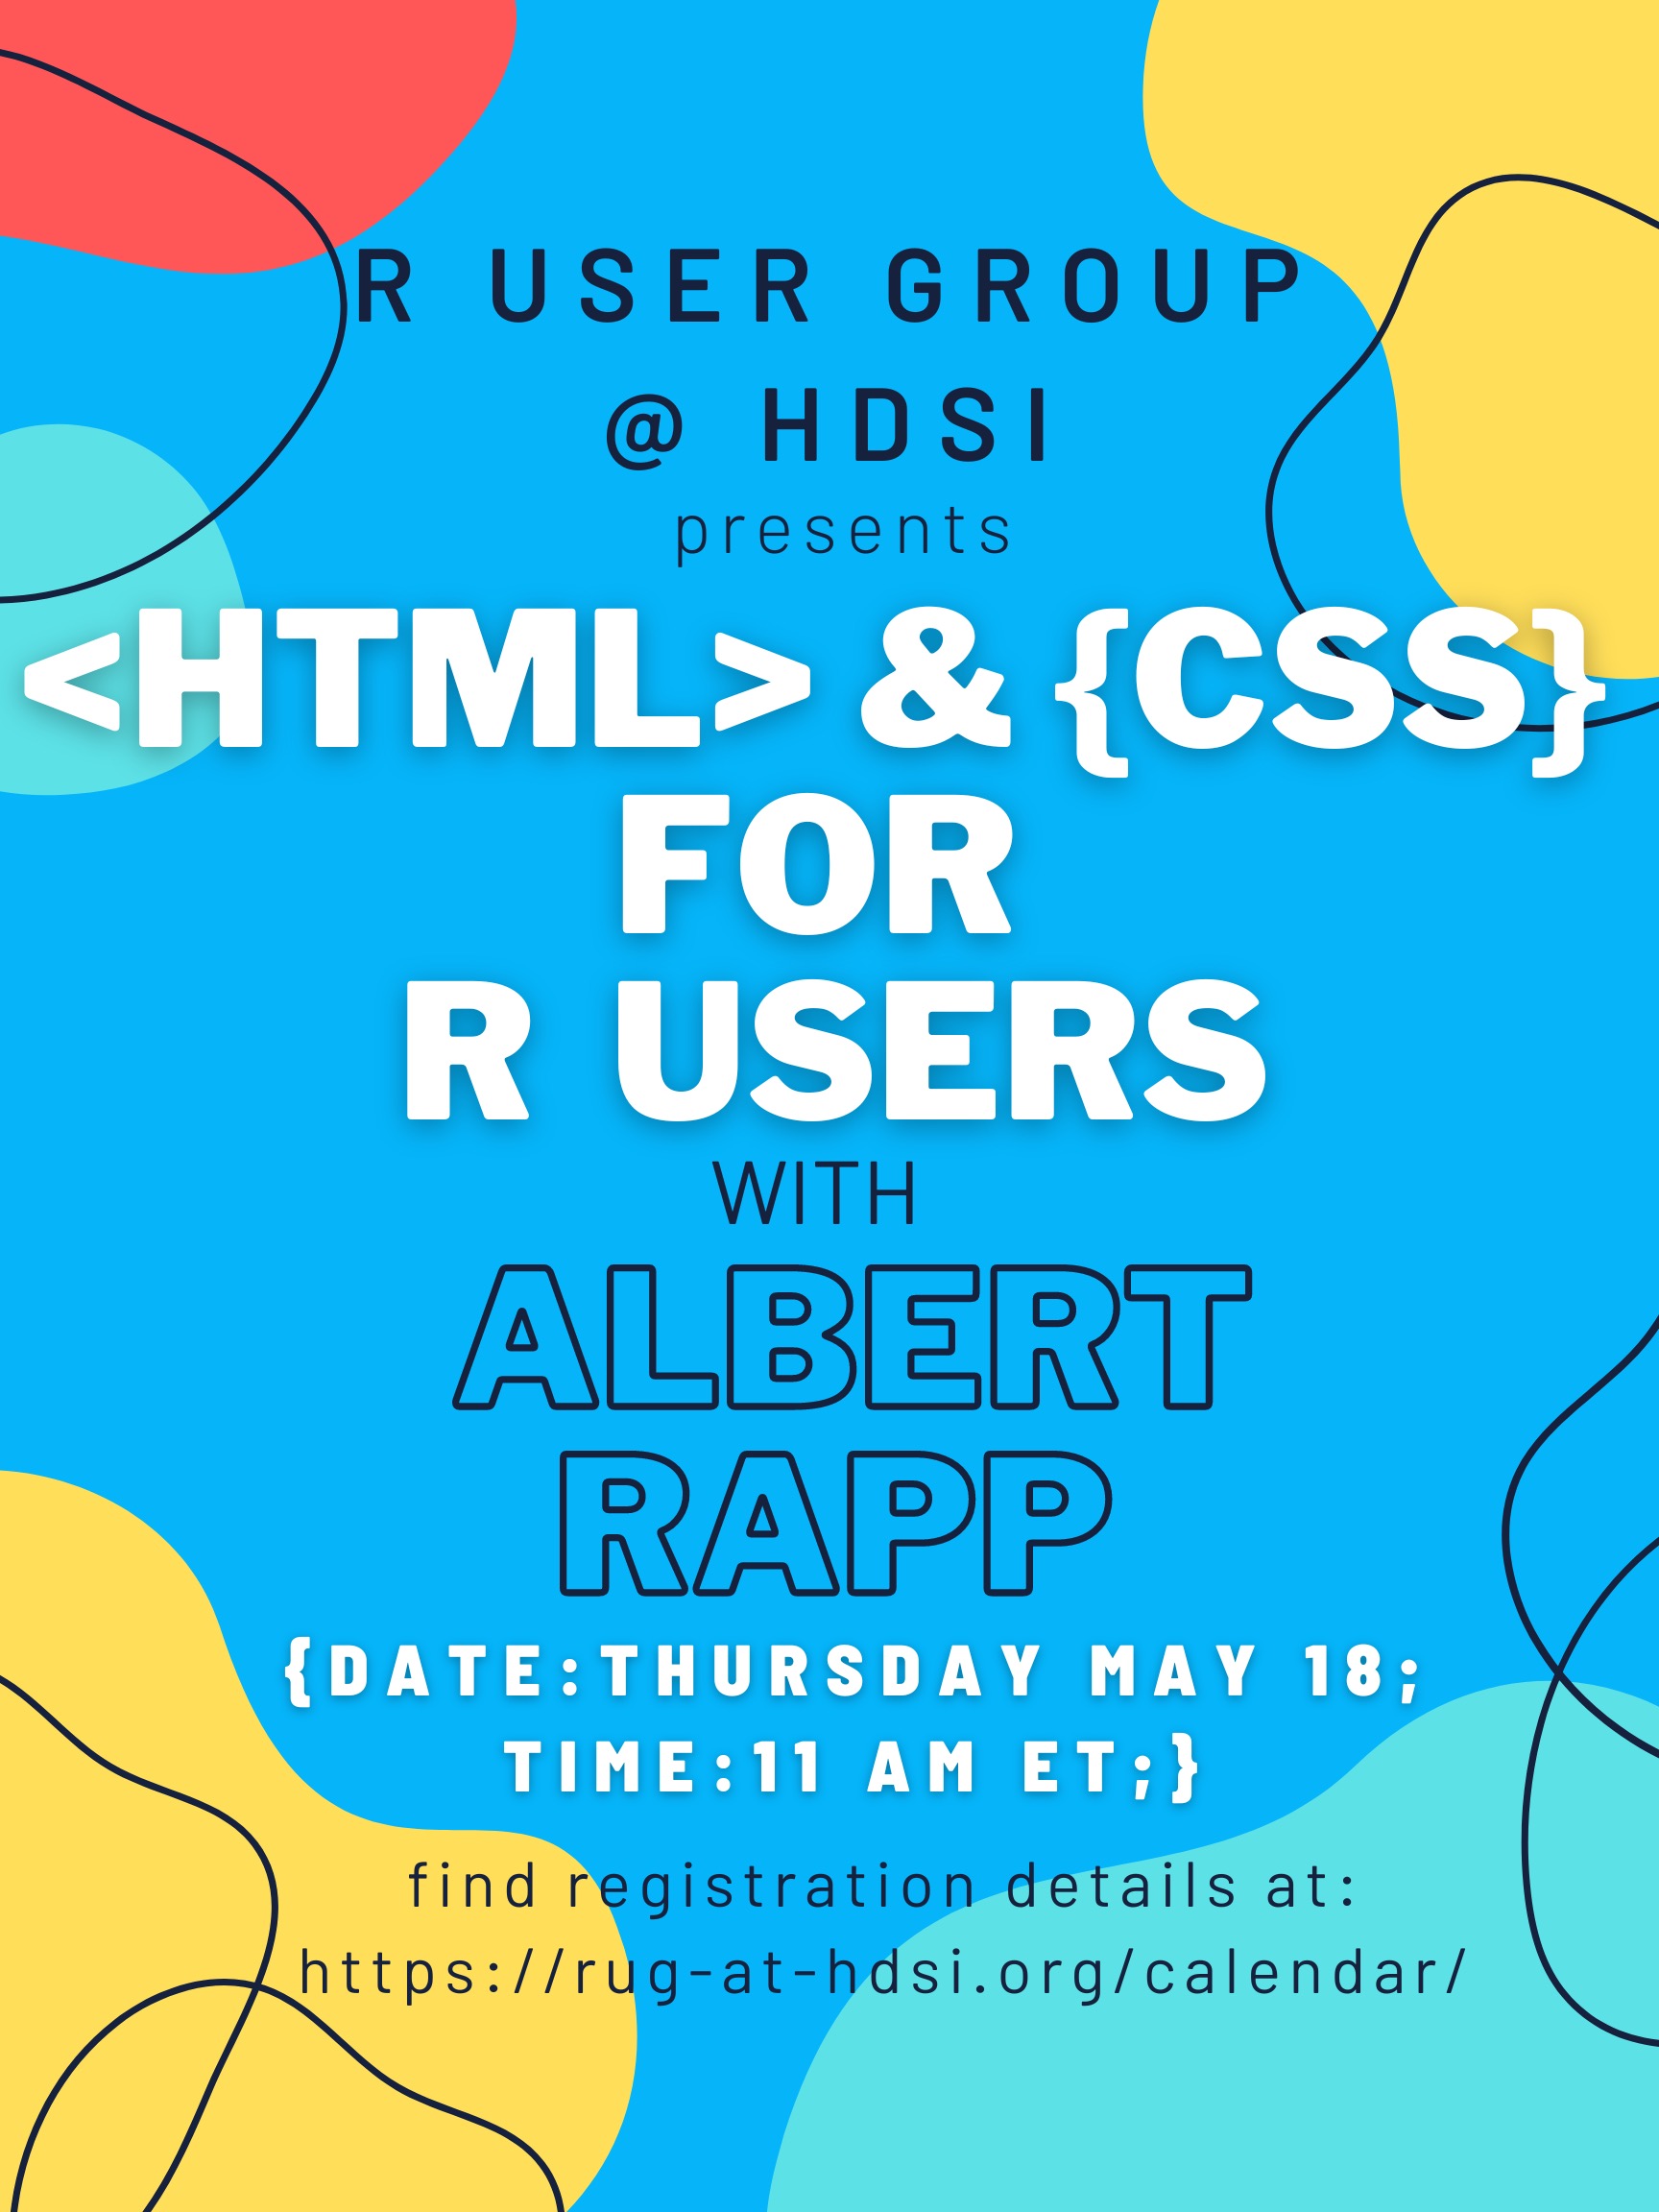
It's easy to think that R users do not need HTML & CSS. But these web languages are everywhere, even in R. Knowing just a bit of HTML & CSS can unlock the full potential of popular R tools like {gt}, {ggtext}, {shiny}, and Quarto.
This talk is split into two parts. First, I will motivate learning HTML & CSS for R users through various examples. Second, I will show you the necessary basics to get you started on your HTML & CSS journey.
20 April 2023 — Thematic Maps with R
The R software has a rich, dynamic and mature spatial ecosystem. Several R packages allow to leverage the power of major FOSS libraries (like GDAL, GEOS or PROJ) for spatial data management and {mapsf} takes advantage of this ecosystem to create thematic maps. It helps designing various cartographic representations and offers several functions to display layout elements improving the graphic presentation of maps. In this talk, we will present the thematic cartography package {mapsf} and a set of smaller packages dedicated to more specific map types. Spatial representations created with R are fully reproducible and we argue that they can reach the same visual quality level as those built with a classical mapping or GIS software.
16 March 2023 — Towards the Next Generation of Shiny UI
Shiny, the R package for creating interactive web graphics, recently celebrated its 10th birthday. Since then, Shiny has grown tremendously in many areas (e.g., performance, functionality, extensions, etc); however, a "hello world" Shiny app still looks like it did 10 years ago. This is mostly because Shiny goes to great lengths to ensure backwards compatibility; and as a result, default Shiny UI will likely continue to be based on Bootstrap 3 (a CSS styling framework released in 2010). However, thanks to the new bslib R package, it is now easy to opt-into a modern Bootstrap 5 foundation that "just works" with Shiny, R Markdown, flexdashboard, pkgdown, bookdown, and more.
In addition to upgrading Shiny's Bootstrap dependency, bslib also makes it much easier to do custom theming, leverage modern layout techniques, and create custom components (all from R without any CSS/HTML/JS required). At this point, bslib is still maturing, and does not yet provide what we'd consider a "complete UI toolkit", but it should eventually replace and/or improve upon all of Shiny UI. In this talk, I'll highlight bslib features that we're most excited about (e.g., expandable cards, accordions, (sidebar) layouts, input controls, etc.), discuss some best design practices for improving user experience with these tools, and present some real world examples of these tools in action.
12 January 2023 — Towards the Development of Bioinformatics Tools
Join us as Chanin describes the thought process that goes behind the compilation and curation of bioactivity datasets, building machine learning models and deploying it as a web app using Shiny in R.
15 December 2022 — Creating Publication-Ready Summary Tables with {gtsummary}
This talk will introduce the {gtsummary} R package, and will review details of some of the functionality it provides for creating publication quality analytical and summary tables. The talk will cover basic descriptive statistic tables as well as tables of regression results, and will highlight some of the features for combining multiple tables and including results from tables with inline text in Rmarkdown reporting.
27 October 2022 — Using RStan for Bayesian Statistics
Join us to learn about how you can use RStan to perform Bayesian statistics in R! This talk will provide an introduction to what Bayesian statistics and RStan are and how you can get started using them. Fayette Klaassen will introduce how to write a Stan program and describe the workflow using Stan as well as go over some example Stan models. Finally, we'll go over some common troubleshooting tips and examples in practice.
29 September 2022 — Level Up Your Plots
Polished annotations can make all the difference between a good plot that contains all the necessary information, and a great plot that engages readers with a clear story.
This talk will build on the Introduction to ggplot session, exploring how we can make good use of design tips (and the coding tricks behind!) to help readers understand
the key messages that our datavisualisations seek to convey. We will build an annotated plot step by step and discuss why we're doing things the way we are along the way.
By the end of the session, you'll have a clear grasp of how to:
- use colour in the explanatory text as well as in the plot to help the readers orient themselves
- use primary and secondary text colours and fonts to help the main message stand out
- create labels to add information about specific data points
- add arrows and use text alignments to draw attention to important details
- modify the theme and other parameters to give everything some space to breathe
18 August 2022 — Intro to Git and GitHub with R and RStudio
Join us to learn about how to use the Git software to version control your code and much more. Version control software, like Git, is like track changes for your code, but even more powerful! Git enables you not just to track the iterations of your codebase, but to easily collaborate with others (without emailing zip files back and forth!), to go back in time to check how your code used to look, to safely test out new ideas, and much more. GitHub is an online service that provides free Git services so you can use it to backup your Git repositories, share them with others – and even build out websites and a professional portfolio of your software and programming work. GitHub is one of the most relevant technologies for any programmer, so we welcome you to join us to learn how you can leverage Git and GitHub for your R programming adventures!
30 June 2022 — Celebrating our 1 Year AnniversRy
Come join us to celebrate our one year anniversRy! Mingle with fellow R users, learn about opportunities to engage with the R community, share your favorite recent R related events, and get excited for the return of jeopaRdy!!
19 March 2022 — Creating Interactive Tutorials with {learnr} by Yanina Bellini Saibene
The {learnr} package makes it easy to turn any R Markdown document into an interactive tutorial. Tutorials consist of content along with interactive components for checking and reinforcing understanding. Tutorials automatically preserve work done within them, so if a user works on a few exercises or questions and returns to the tutorial later they can pick up right where they left off. Learn more about {learnr} here.
10 March 2022 — Creating features for machine learning from text
Julia Silge is a software engineer at RStudio PBC where she works on open
source modeling tools. She holds a PhD in astrophysics and has worked as a data
scientist in tech and the nonprofit sector, as well as a technical advisory
committee member for the US Bureau of Labor Statistics. She is an author, an
international keynote speaker, and a real-world practitioner focusing on data
analysis and machine learning. Julia loves text analysis, making beautiful
charts, and communicating about technical topics with diverse audiences.
Natural language that we as speakers and writers use must be dramatically
transformed to new representations for analysis, whether we are just starting
off with exploratory data analysis or are ready to train machine learning
algorithms such as predictive models. We can explore typical text preprocessing
steps from the ground up, from tokenization to building word embeddings, and
consider the effects of these steps. When are these preprocessing steps
helpful, and when are they not? In this talk, learn about the process of text
preprocessing for ML models in the real world, how and when practitioners use
different preprocessing choices, and considerations for text ML tooling.
17 February 2022 — R you my Valentine?

Join us to share tips and tricks that make you *love* R!
20 January 2022 — Organizer Interest Meeting
Are you interested in helping us make our R User Group better? Join our Organizer Interest Meeting! We will have free time to discuss what you'd like to see us do with the organization, suggest guest speakers, and volunteer yourself to help us organize our R User Group.
02 December 2021 — Introduction to ggplot2
Do you want to take your data visualization skills to the next level? Come to
our talk on ggplot2, a package in R that uses the grammar of graphics system to
make it easy to create everything from simple and stunning to complex and
sophisticated plots.
Our talk will cover three ways to use ggplot2:
- the basic ways you can use ggplot2 to create simple data visualizations,
- the extensions to ggplot2 that you should know about and help you quickly create more advanced data visualizations, and
- how you can create functions that use ggplot2 to help you automate creating data visualizations.
18 November 2021 — Cooking Your Data with Recipes
Recipes are tools for preprocessing data prior to modeling or visualization. You can think of them as a mash-up between `model.matrix()` and dplyr. We'll walk through some recipes and how they can be used with models or visualizations that use dimension reduction.
21 October 2021 — Intro to {dplyr} and USAFacts COVID-19 Data
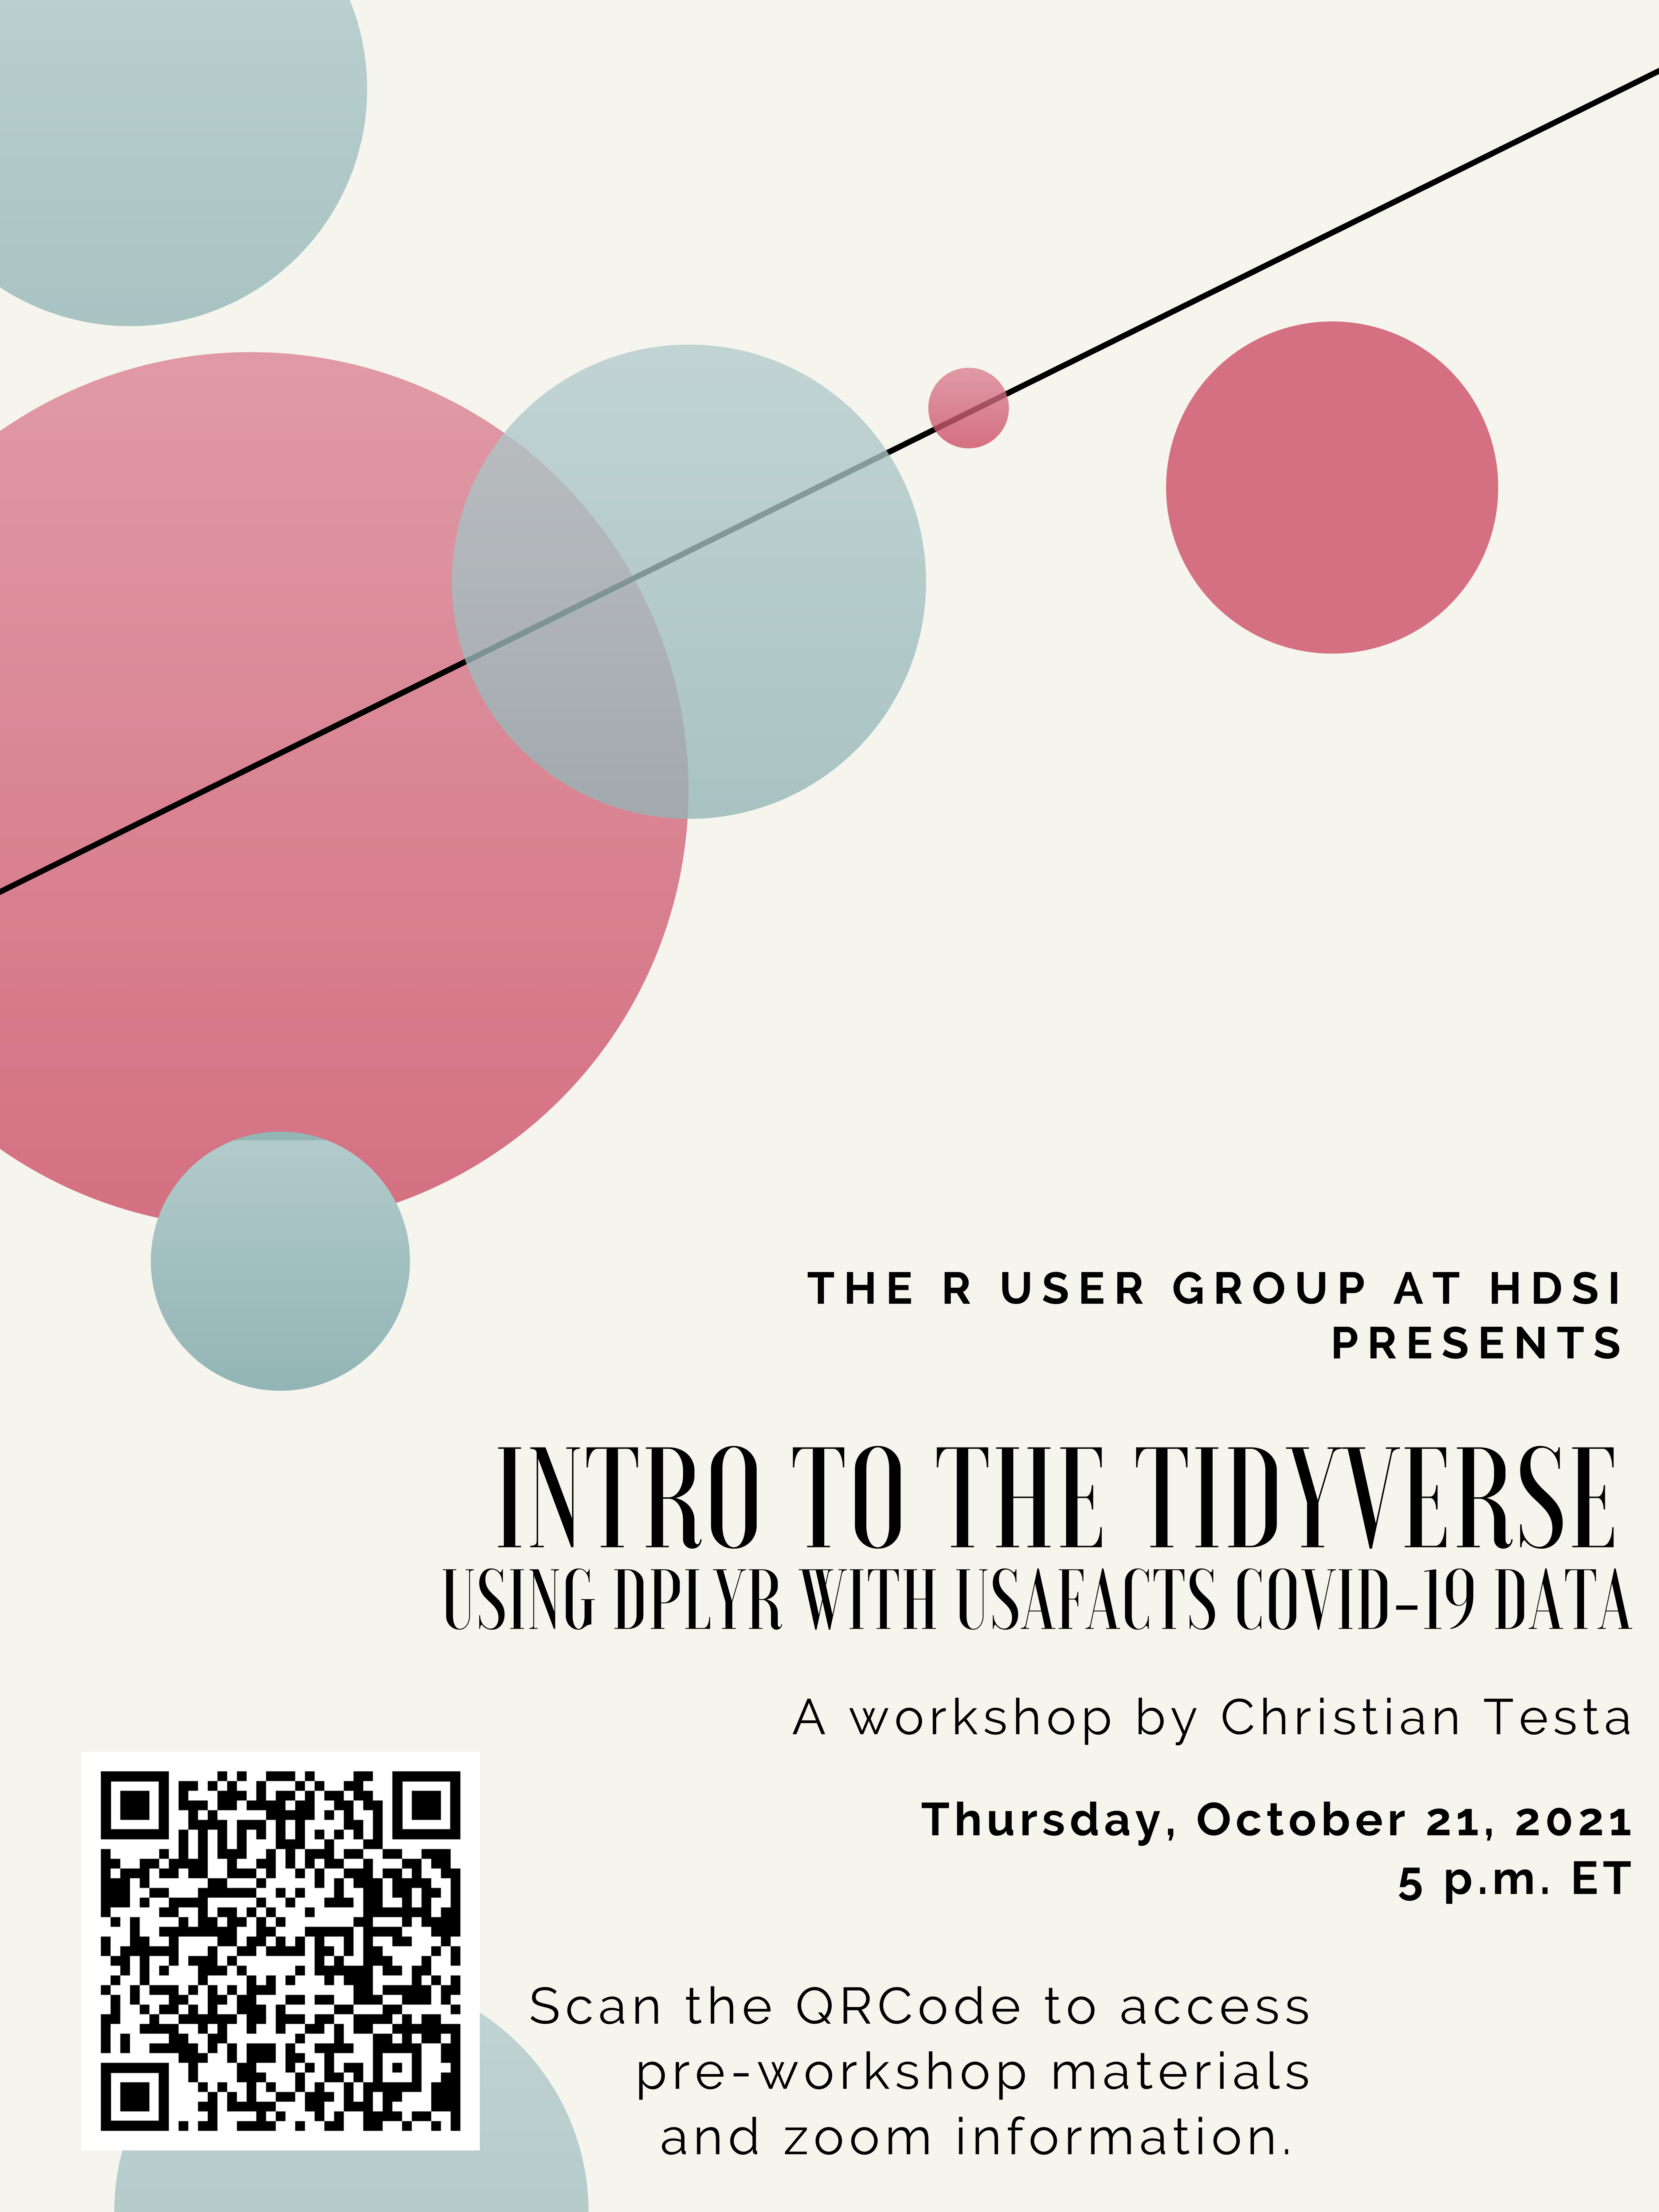
Join us for an introductory talk on how you can use {dplyr} to transform and analyze data. We will introduce the principles behind the tidyverse and teach you how to create new variables, transform existing ones, tidy data from a wide format to a long format (or vice versa), and more.
19 August 2021 — R Trivia & Happy Hour
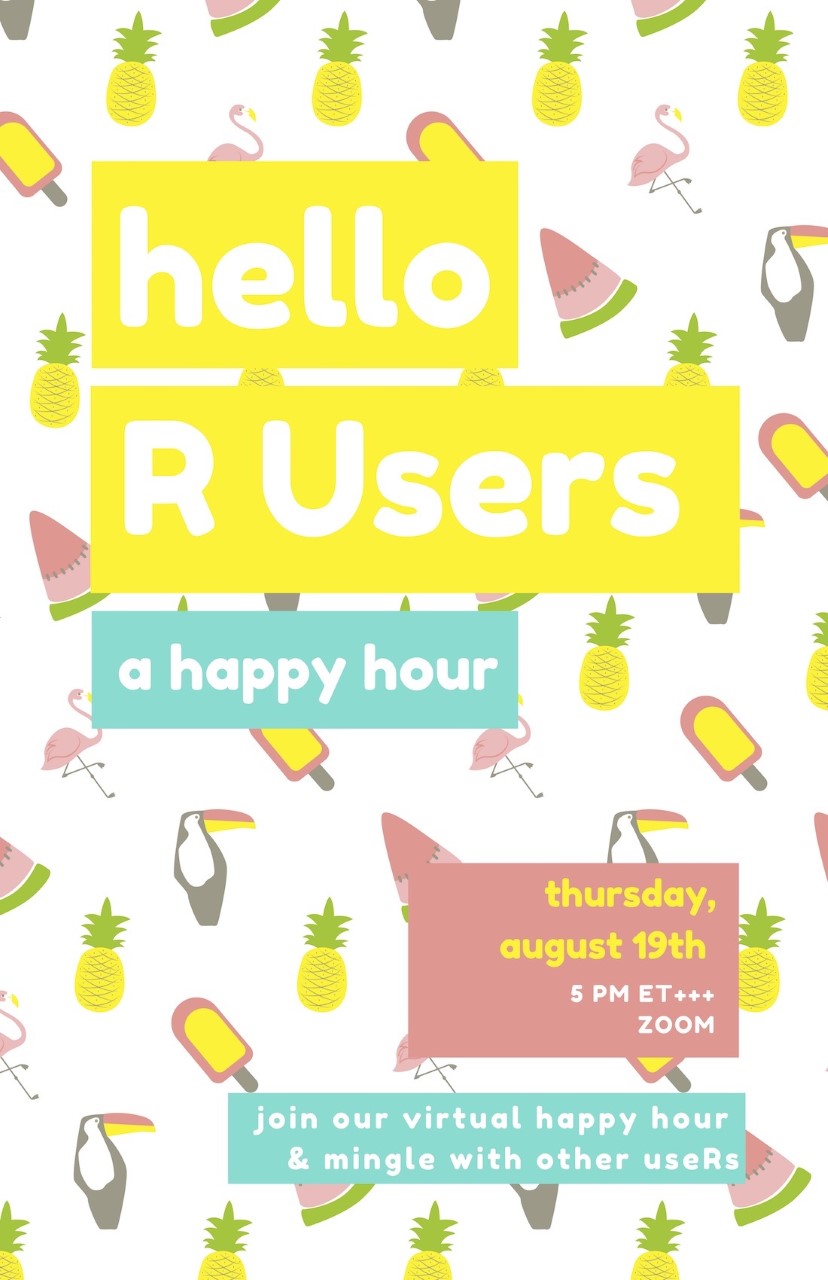
Join us for a virtual happy hour and mingle with other R users!
05 August 2025 — {plumber}: An API Generator for R
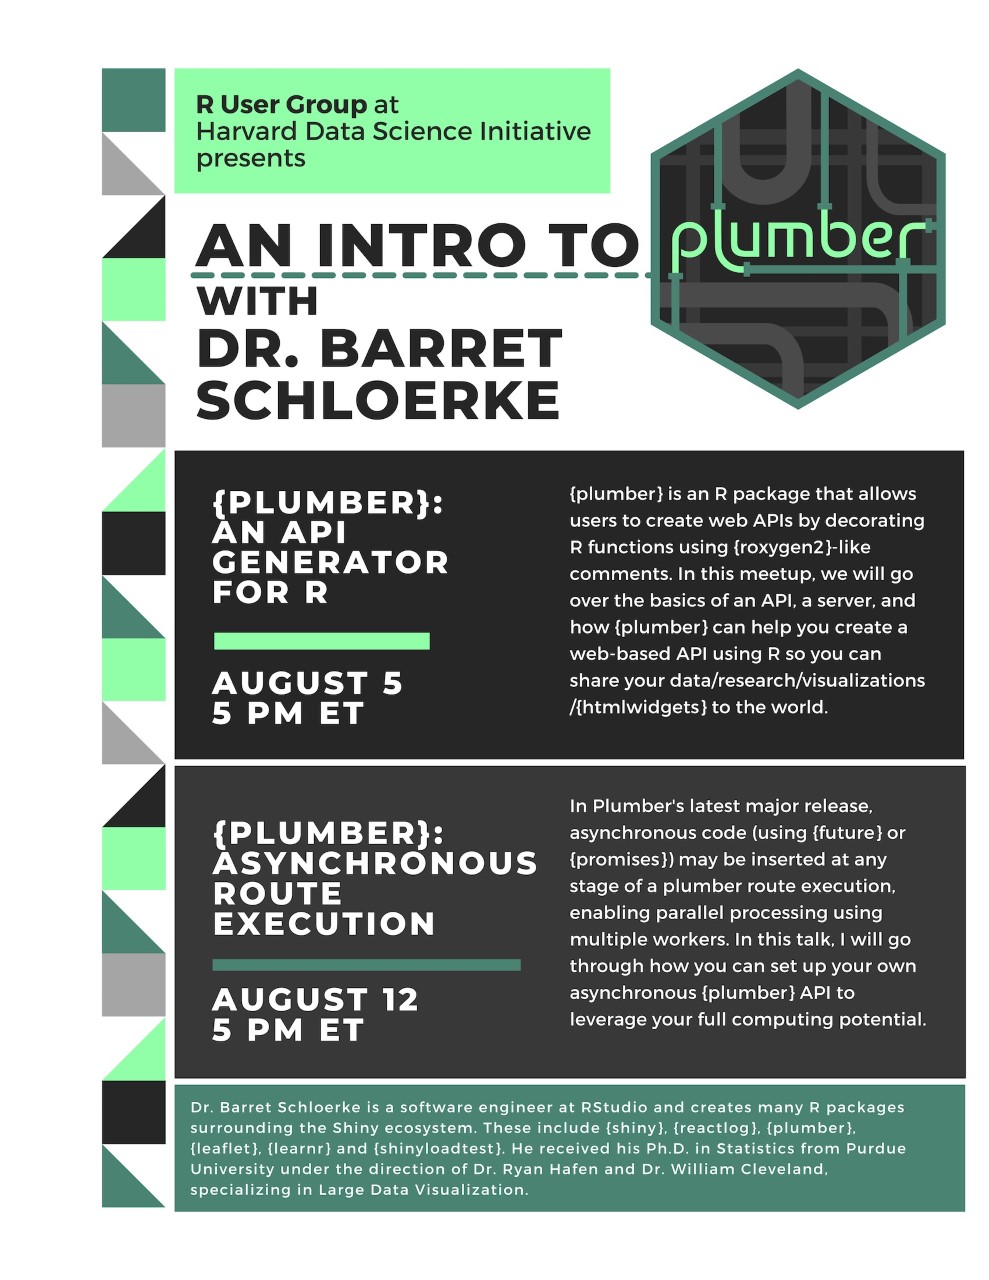
{plumber} is an R package that allows users to create web APIs by decorating R functions using {roxygen2}-like comments. In this meetup, we will go over the basics of an API, a server, and how plumber can help you create a web-based API using R so that you can share your data/research/visualizations/{htmlwidgets} to the world.
14 July 2021 — BeginneR's Workshop
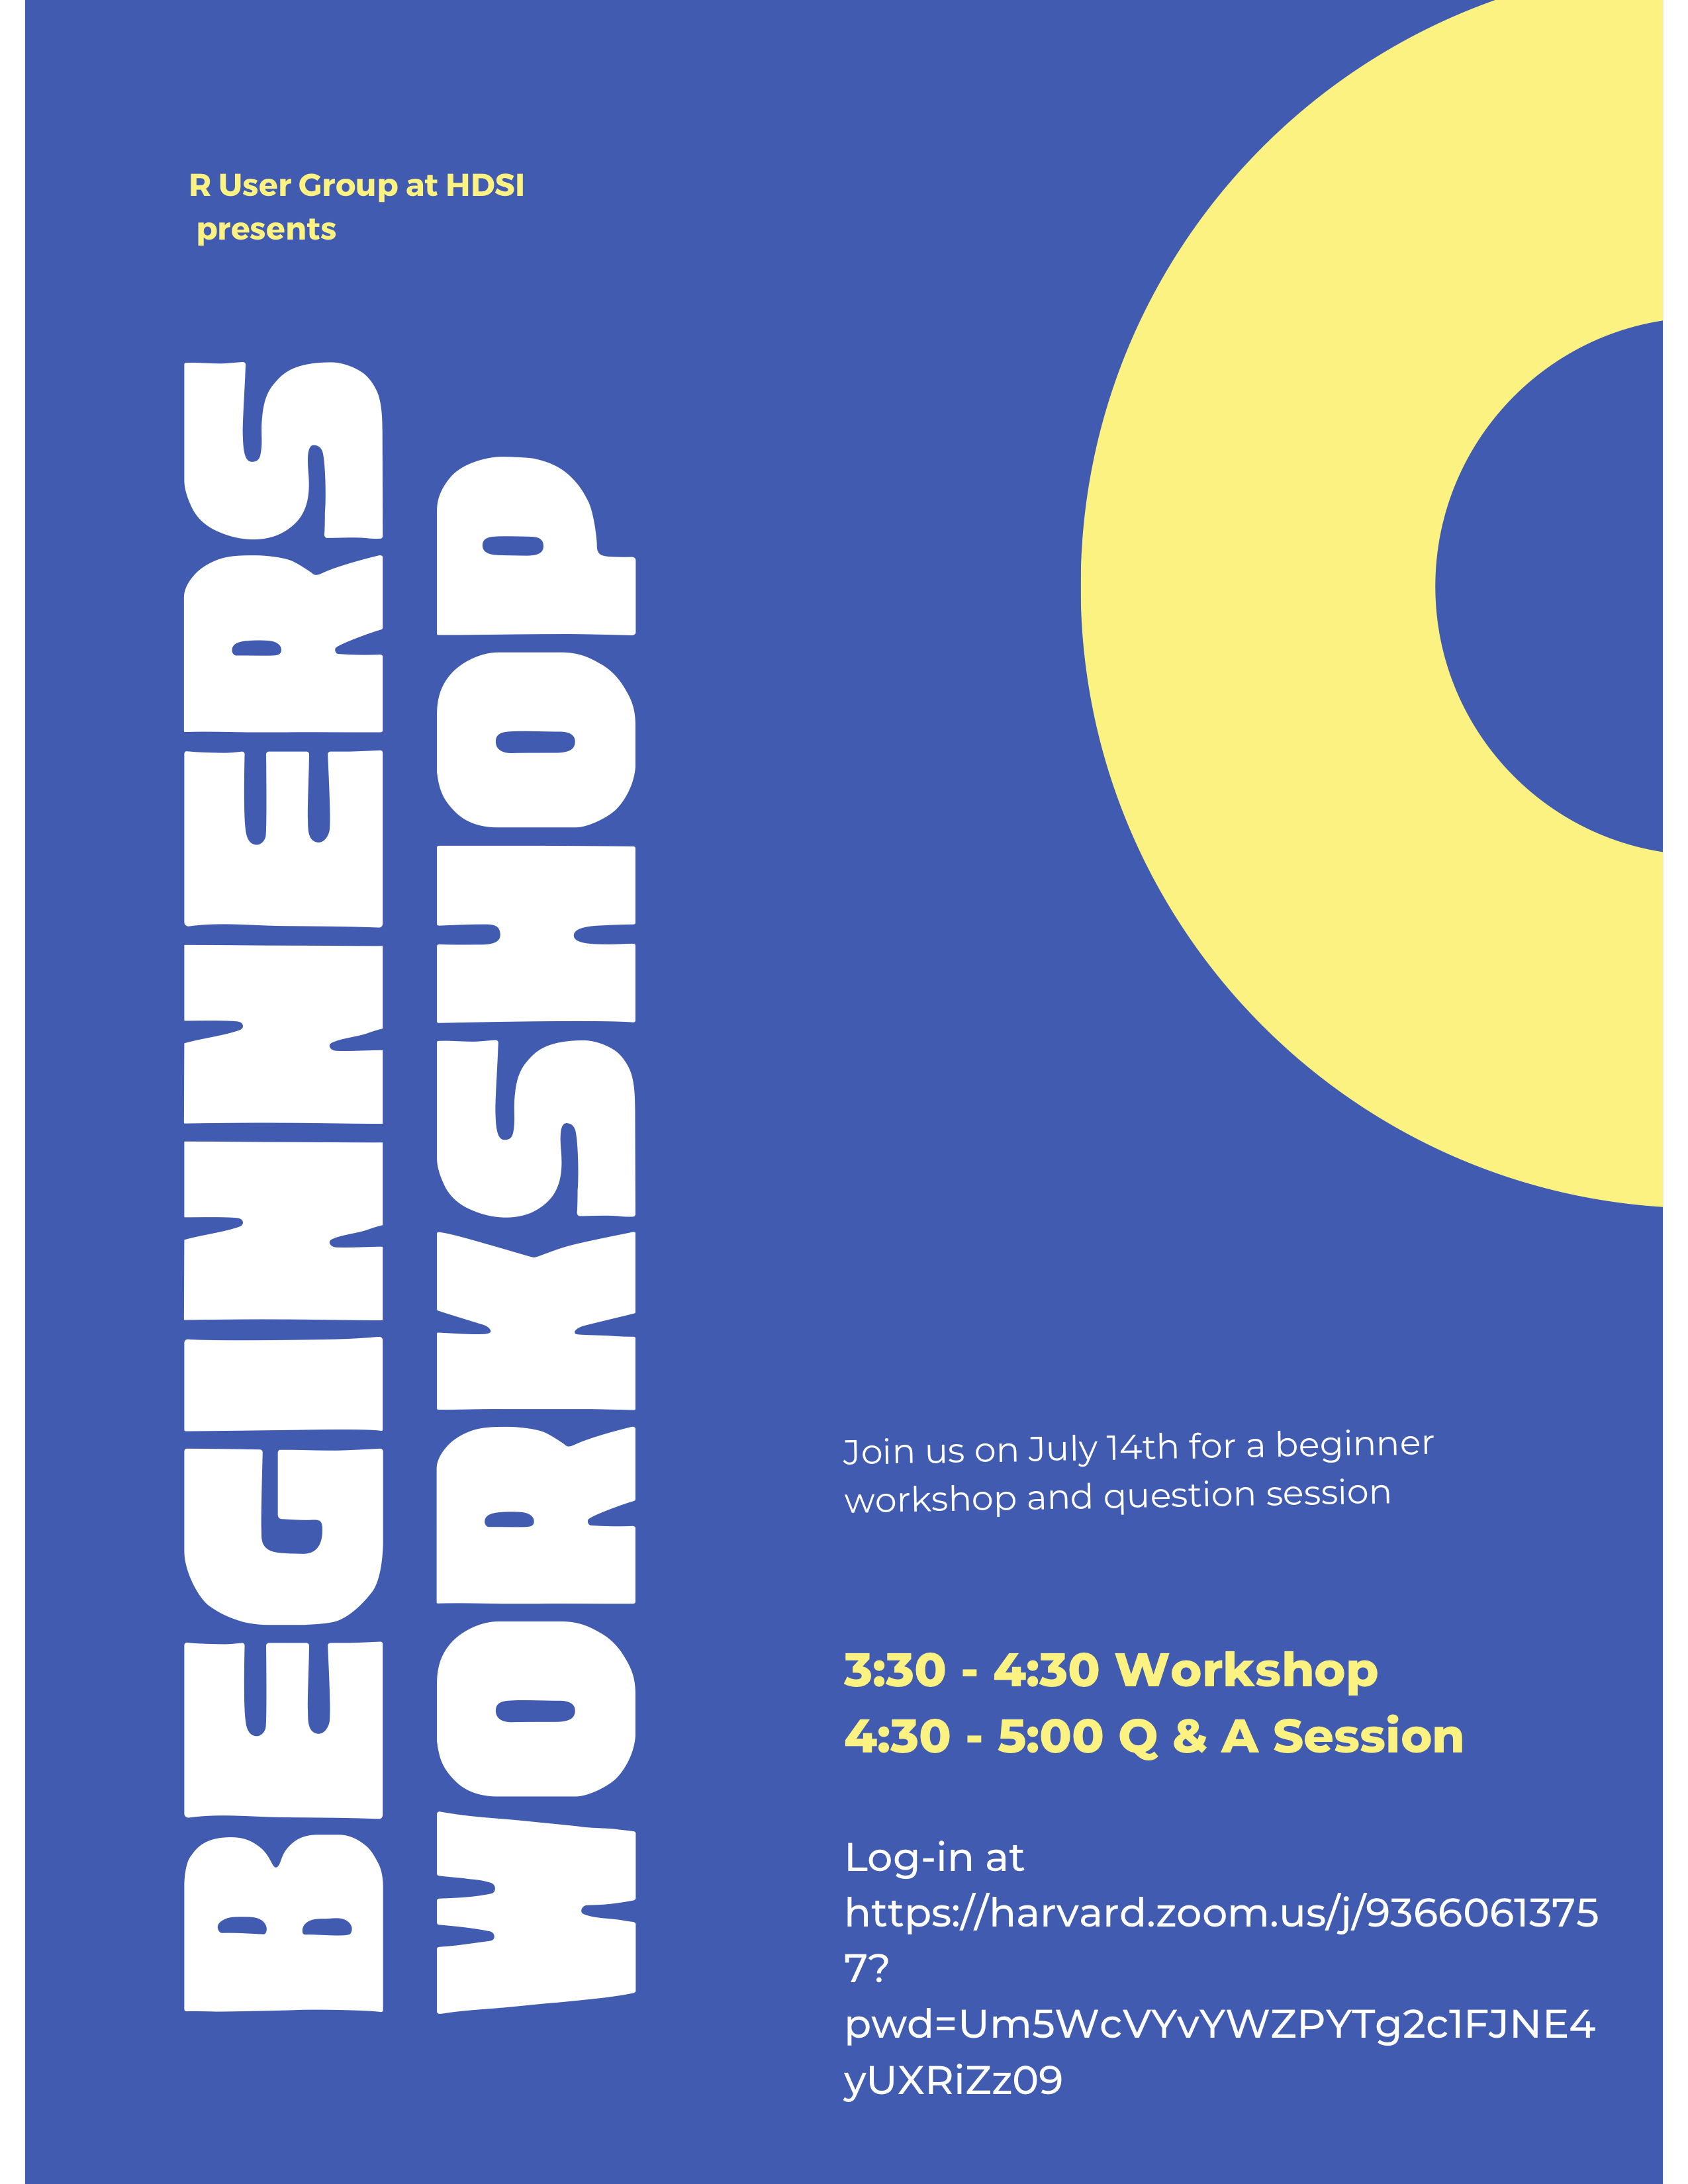
Join us for an introductory session on using R and RStudio to analyze data and create data visualizations.
22 June 2021 — TidyTuesday Lunch & Learn
We watched a pre-recorded (available on YouTube) talk from Julia Silge on how she analyzed highly ranked hip hop songs using data from the Spotify API and using principal components analysis.
10 June 2021 — First Inaugural RUG Meeting
In our first meeting we learned about who was attending through casual conversations and surveys and what people are looking for from our organization.